Real-time actionable insight, no programming
Making the right decisions about your data is critical to the success of your organization. Feith’s Dashboard iQ and Reports iQ tools give you the ability to quickly and easily analyze your data to make informed decisions.
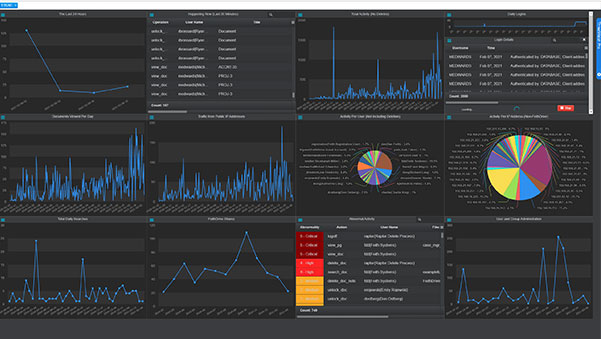
Feith’s Dashboard iQ tool provides you with an easy-to-use interface for creating custom real-time visualizations of your data. The Reports iQ tool takes your data analysis to the next level by allowing you to create custom report templates and schedule reports for export and sharing. By visualizing your organization’s vital data, you can quickly identify trends and make decisions that will improve your overall performance. Feith’s Dashboards and Reports are integrated closely with our entire platform.
Make great decisions
Creating a dashboard is easy with Feith’s drag-and-drop designer tools. Simply select the data you want to include and how you want it displayed, and Feith will take care of the rest. You can even create multiple versions of a dashboard or report, so you can tailor the information to different audiences.
- Real-time performance data.
- Filter graphs live by field or dates.
- Graph from multiple databases.
- Simple DIY designer tool.
- Web-based dashboard interface.
- Click to see the rows of data.
- Keep the pulse on your workflows.
Informed confidence
Automatically generate and deliver reports via email or direct links. You can even schedule the reports to print automatically or provide access through a secure web portal to maintain an audit trail.
Create custom dashboards to get a quick overview of your process performance, or generate detailed reports for in-depth analysis. Use the right-hand filter bar allows to quickly and easily filter your dashboard by field or date, and watch it update live. With Feith, you’ll have all the information you need at your fingertips, so you can make the decisions that keep your organization running smoothly.
Both accurate up-to-date and historical information are key to identifying trends, soft spots, and clogs in your processes, so you can make the split-second and long-term decisions that keep your organization productive. With Feith, create a variety of dashboards and reports to visualize the information underlying all of your processes.
Whether you’re looking for a quick overview of your process performance or need to generate detailed reports for in-depth analysis, Feith has you covered.